Blog
The lab I’m working at has a shared server, and storage space is always a concern.
- ‘How much space is left in each directory?’
- ‘Which directories are the largest?’
- ‘Who is using up the most space?’
These types of questions come up frequently, and we needed a clear way to get a snapshot of the storage situation.
The Challenge
Since I didn’t have sudo access, I couldn’t install monitoring tools or modify system-wide configurations. So, I had to come up with a solution that didn’t require administrative privileges.
I decided to set up a monitoring stack using Node Exporter, Prometheus, and Grafana to track where space was being used.
This might be an overkill for a simple task, but as an ex-production engineer, I couldn’t resist the opportunity to play with the tools I know and love. Here’s how I went about doing it.
The Setup
What You’ll Need
Before diving into the setup, you’ll need the following:
- A server where you can run services - if you have
sudo, great. If not, you can run them as a user like I did. - If your server has a firewall (like mine), the ability to use SSH port forwarding since direct browser access isn’t possible due to the firewall.
Setting Up Node Exporter
The first piece of the puzzle was Node Exporter, which collects system-level metrics such as storage, CPU usage, and memory.
Installing Node Exporter as a User-Level Service
Download the Node Exporter binary from the Prometheus GitHub releases.
Extract it to your chosen directory:
tar -xvzf node_exporter-<version>.tar.gzNow, we need to run Node Exporter as a user-level service using
systemd. Create anode_exporter.servicefile in~/.config/systemd/user/:[Unit] Description=Node Exporter [Service] ExecStart=/path/to/node_exporter User=your_username Restart=always [Install] WantedBy=default.targetEnable and start the service:
systemctl --user enable node_exporter
systemctl --user start node_exporter
With the service running, you can access your Node Exporter metrics at http://localhost:9100.
Accessing Metrics Through SSH Port Binding
Since our server has a firewall, accessing the metrics directly via the browser wasn’t possible. Instead, I used SSH port forwarding to forward the Node Exporter port to my local machine.
Here’s the command to forward the port:
ssh -L 9100:localhost:9100 user@remote-server
This binds port 9100 on your local machine to the Node Exporter port on the server, letting you access the metrics from your browser at http://localhost:9100.
Setting Up Prometheus
Next, I set up Prometheus, the monitoring system that scrapes metrics from Node Exporter.
Download Prometheus from the official website.
Extract the binary and navigate to the directory where you’ve saved it.
Modify the
prometheus.ymlconfiguration file to scrape metrics from the Node Exporter:global: scrape_interval: 15s scrape_configs: - job_name: 'node' static_configs: - targets: ['localhost:9100']Start Prometheus with the following command:
./prometheus --config.file=prometheus.yml
To ensure Prometheus runs as a user-level service, create a prometheus.service file in ~/.config/systemd/user/:
[Unit]
Description=Prometheus

[Service]
ExecStart=/path/to/prometheus --config.file=/path/to/prometheus.yml
User=your_username
Restart=always

[Install]
WantedBy=default.target
Enable and start the Prometheus service:
systemctl --user enable prometheus
systemctl --user start prometheus
You can access Prometheus at http://localhost:9090 via the same SSH port forwarding method used for Node Exporter.
Setting Up Grafana
Finally, I set up Grafana, which I use to visualize the metrics collected by Prometheus.
Download the Grafana binary from the official website.
Extract and start Grafana:
./bin/grafana-server webTo make Grafana run as a user-level service, create a
grafana.servicefile in~/.config/systemd/user/:[Unit] Description=Grafana [Service] ExecStart=/path/to/grafana/bin/grafana-server web User=your_username Restart=always [Install] WantedBy=default.targetEnable and start the Grafana service:
systemctl --user enable grafana
systemctl --user start grafana
Access Grafana at http://localhost:3000. You can log in with the default credentials: admin/admin.
Example Dashboard
With the monitoring stack in place, I created some dashboards. One of them was to visualize storage usage across our multiple storage volumes.
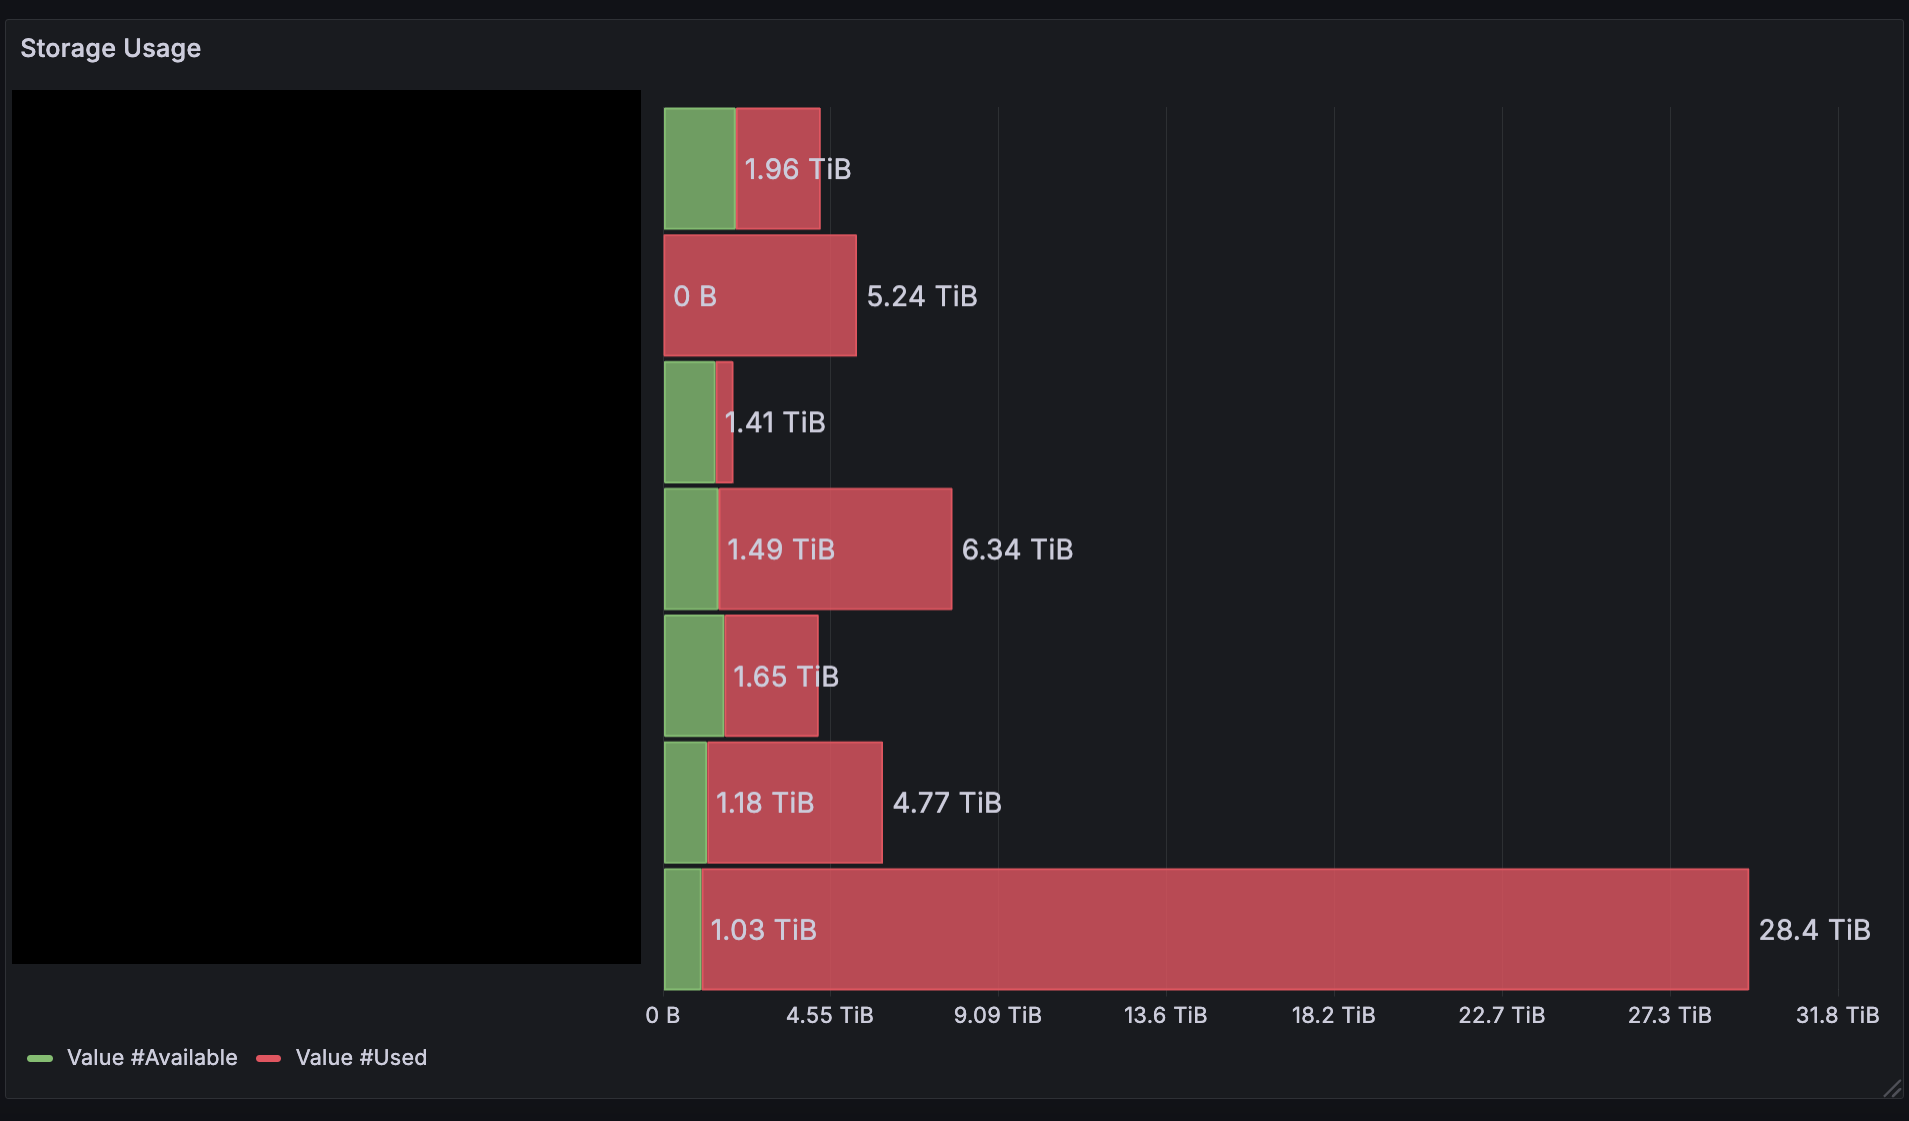
I used a stacked bar chart, where each device had a bar showing both used (in red) and available space (in green). The data was pulled from Prometheus, using the node_filesystem_avail_bytes and node_filesystem_size_bytes metrics.
I grouped the data by directory, with the X-axis showing device names and the Y-axis representing storage in bytes. I blacked out the directory names in this picture.
Conclusion
And that’s it! I now have a complete monitoring stack running without sudo.
- I can visualize storage usage on the server.
- Track the available disk space.
- See which directories are using the most space.
Since everything runs as user-level services, I don’t need root access. Plus, it’s all wrapped up in a shiny Grafana dashboard.
If you want to add more metrics or create additional dashboards, Grafana makes it super easy to customize. Now that the system is set up, adding new monitoring services is as easy as tweaking a few configuration files.
Happy monitoring!